

Lesson 9 of 102 steps · about 2 minutes
Look at what you’ve started
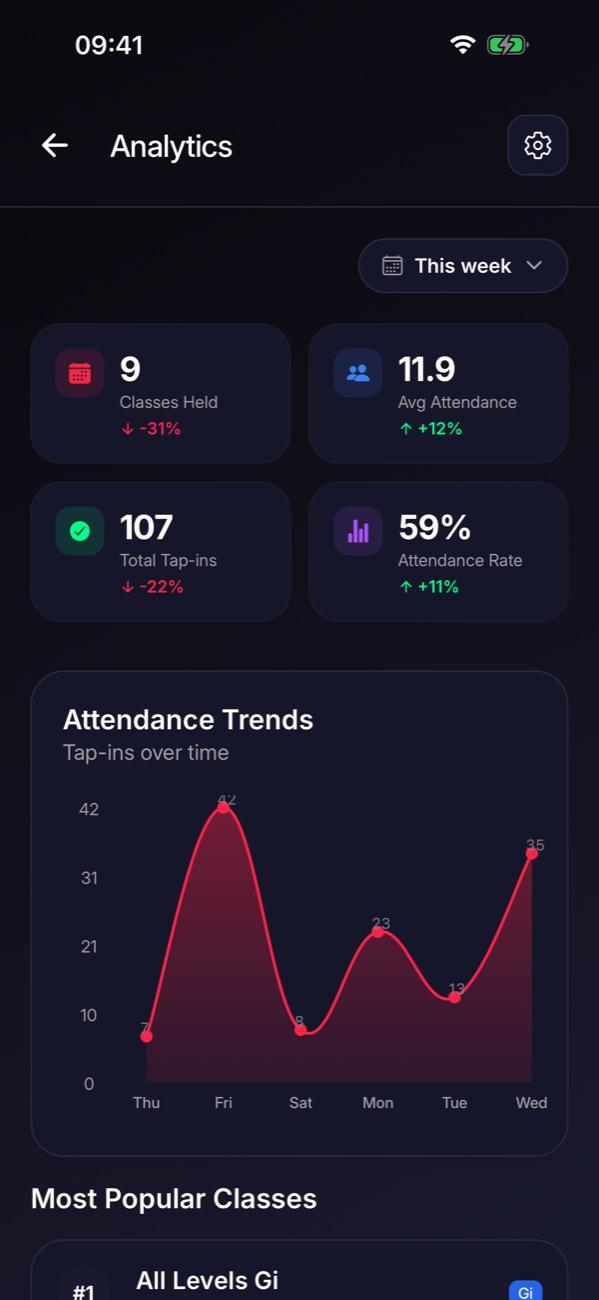
Your dashboard shows how classes are going, week by week.
Step 1 of 2
Open Analytics
Go to Manage and tap Analytics. Pick a period: this week, this month or all time.
Step 2 of 2
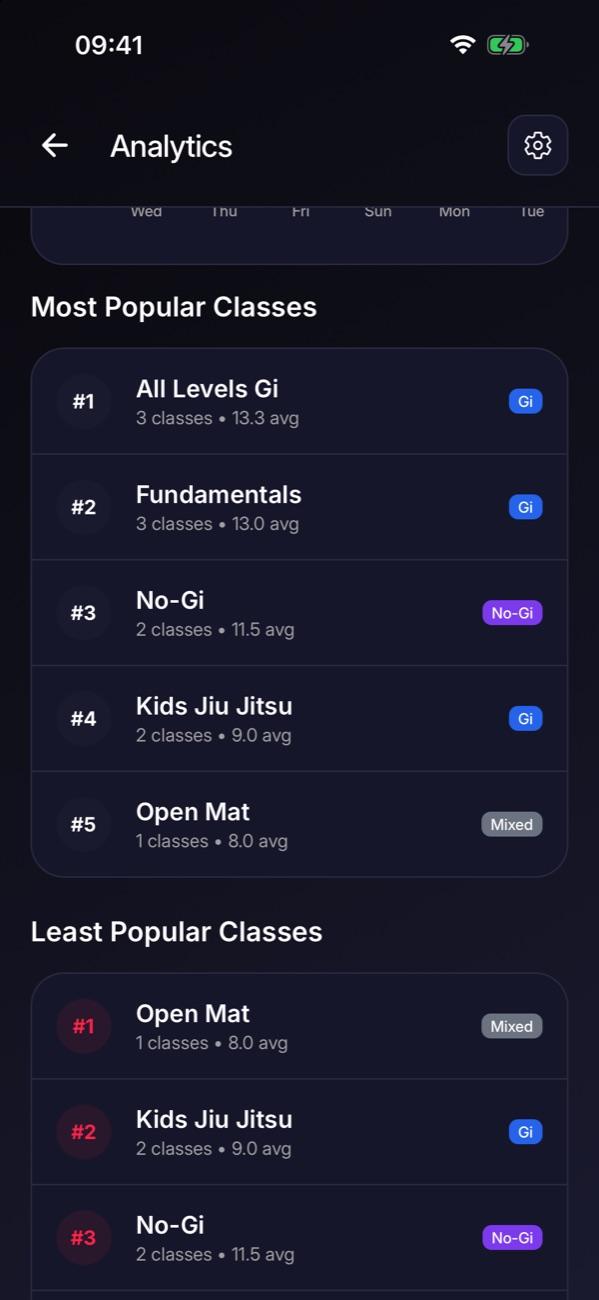
Spot your best classes
Scroll for attendance trends and your most and least popular classes.

Stuck on this step?
Ask Darcy, or email us and we’ll help you set it up.